In general, Firefox and Safari are favorite browsers of designer, however Internet Explorer and Opera are many people use for their design work, because it hass integrated into the operating system or simply just because they like to use it.

In a previous article I talk about The Essential Firefox Add-ons for Web Designers, this article continues to mention for the content on the browser of Microsoft Internet Explorer.
Internet Explorer Developer Toolbar
Firefox has Firebug and webdeveloper to fire out all the bug in Mozilla, IE has developer toolbar! This toolbar created by Microsoft and gives most of the ability of both Firebug and webdeveloper but not all of it.
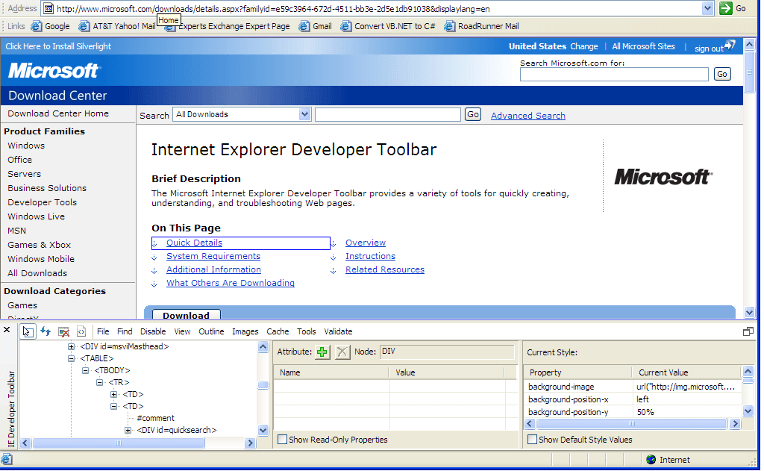
Internet Explorer Developer Toolbar (sometimes shortened to IE Developer Toolbar or even IE DevBar), is an add-on for Internet Explorer 6 and Internet Explorer 7 that aims to aid in design and debugging of web pages. It allows validating of CSS and HTML, previewing page layout at various resolutions, and offers a ruler (measuring in pixels) to aid in positioning the elements. It allows viewing the source of the entire page, color coded for ease of navigation, or selected elements of it, as well as view the DOM source and the CSS selectors that are applied to the element. It also enables viewing the properties and styles of each element and trace styles of elements to its declaration.
Fiddler2
Fiddler is a Web Debugging Proxy which logs all HTTP(S) traffic between your computer and the Internet. Fiddler allows you to inspect all HTTP(S) traffic, set break points, and “fiddle” with incoming or outgoing data. Fiddler includes a powerful event-based scripting subsystem, and can be extended using any .NET language.
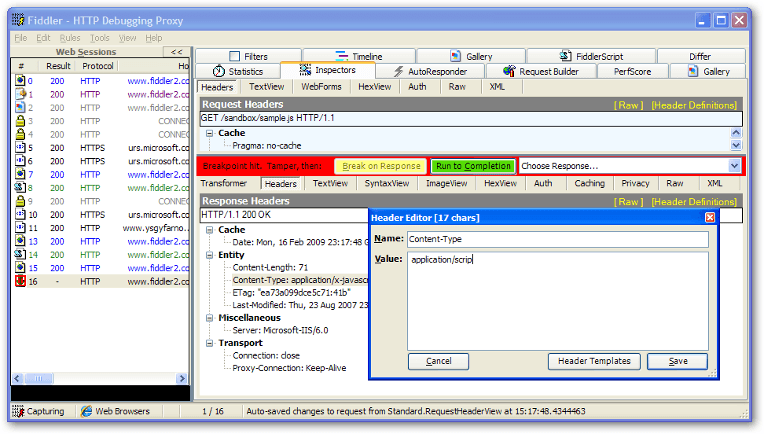
Fiddler is freeware and can debug traffic from virtually any application, including Internet Explorer, Mozilla Firefox, Opera, and thousands more.
Web Developer Helper
Web Development Helper is a free browser extension for Internet Explorer that provides a set of tools and utilities for the Web developer, esp. Ajax and ASP.NET developers. The tool provides features such as a DOM inspector, an HTTP tracing tool, and script diagnostics and immediate window.
Web Development Helper works against IE6+, and requires the .NET Framework 2.0 or greater to installed on the machine.
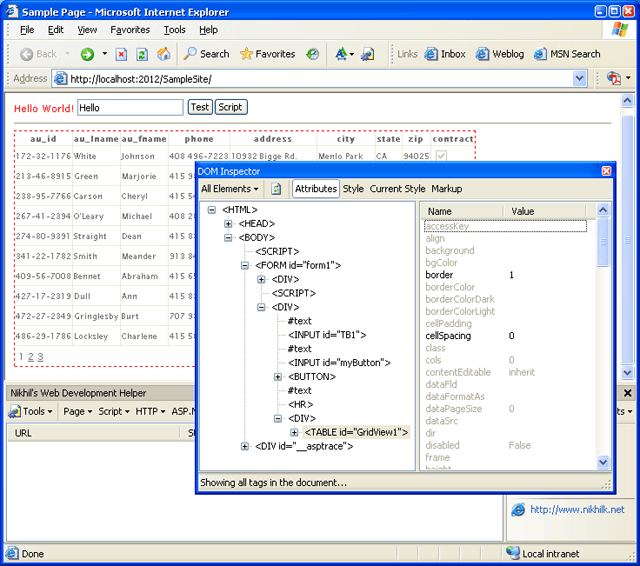
Once installed, the tool is activated using the Tools | Web Development Helper command. You can also customize your browser’s toolbar to add a button for this command to facilitate frequent use. Clicking on the menu command or browser button brings up the tool’s console window and set of commands.
Web Accessibility Toolbar
The Web Accessibility Toolbar, developed by Vision Australia, was designed specifically to assess and analyze the accessibility of a web page, but it’s very useful regardless of whether you’re testing for accessibility or not.
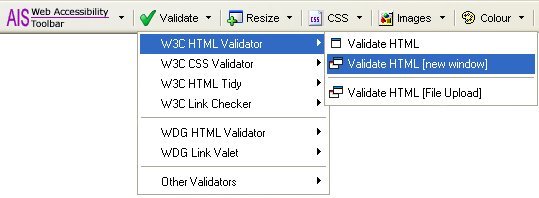
The toolbar has many functions that identify and display specific aspects of a web pages’ code and/or content, either by inserting information into the current page or displaying information about the page in a new window These are designed to help identify the use, misuse or absence of particular HTML markup and presentational properties (CSS) that can affect the accessibility of the page.
DebugBar
DebugBar is an Internet Explorer plug-in that brings you new powerful features. View DOM Tree and modify tags attributes and css attributes on the fly to test your page. View HTTP/S request to check cookies, GET and POST parameters, view server info. View JavaScript functions for easier debugging, see JavaScript and AJAX code.
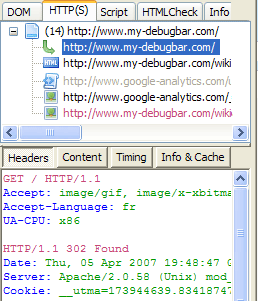
Validate HTML code to correct and optimize your code and html size of your page. See page cookies, get pixel color on a page, make a page screenshot…
HttpWatch
All web applications make extensive use of the HTTP protocol (or HTTPS for secure sites). Even simple web pages require the use of multiple HTTP requests to download HTML, graphics and JavaScript. The ability to view the HTTP interaction between the browser and web site is crucial to these areas of web development:
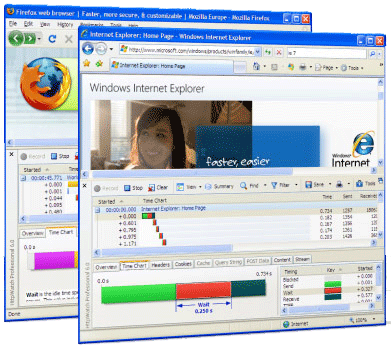
HttpWatch is an HTTP viewer and debugger that integrates with IE and Firefox to provide seamless HTTP and HTTPS monitoring without leaving the browser window.
Firebug Lite
Firebug is an extension for Firefox, but what happens when you need to test your pages in Internet Explorer, Opera, and Safari?
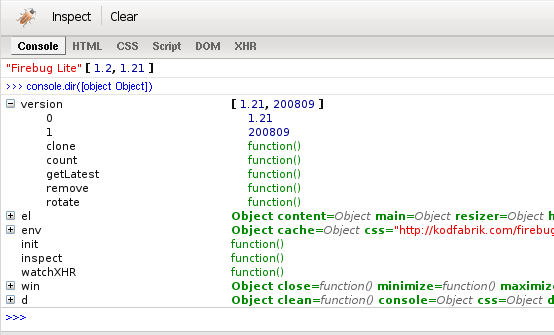
The solution is Firebug Lite, a JavaScript file you can insert into your pages to simulate some Firebug features in browsers that are not named “Firefox”.
Firebug Lite creates the variable “firebug” and doesn’t affect or interfere with HTML elements that aren’t created by itself.
NitobiBug
It’s a browser-based JavaScript object logger and inspection tool – similar to Firebug. NitobiBug runs across different browsers (IE6+, Safari, Opera, Firefox) to provide a consistent and powerful tool for developing rich Ajax applications.
NitobiBug is useful for expert and novice user alike. It makes for faster and simpler debugging of JavaScript and DOM problems.
Have you ever use one of the Internet Explorer extensions above here? Do you know of an extension any other? Share experiences here with us to know the same people.
Very nice article keep it up!